


A Look at First Quarter Performance
One quarter into 2025 and it feels like there is less certainty about how the economy and markets will perform this year than there was at the beginning of the year. Much of the uncertainty comes from Washington where changes in policy have created uncertainty around the economy and financial markets.
While we have some clarity in the areas of immigration policy, tax policy and regulatory reform, the Trump administration’s actions concerning tariffs and the impact of DOGE reforms has led to uncertainty about the economy. In the month of March, we saw significant swings in the stock market as investors were trying to process the impact of tariffs that were announced one day, delayed the next day, and then extended and broadened later in the month. After the quarter-end, on April 2, the Trump administration announced sweeping tariffs which included a minimum 10% tariff on all countries plus a “reciprocal” tariff that was calculated based on the U.S. trade deficit with each country. In total, the new tariffs represent a nearly 10-fold increase in average tariff rates and are the highest tariffs the U.S. has imposed in 100 years. The immediate market reaction was quite negative, with the S&P 500 dropping over 9% in the two trading days after the announcement.
Economists generally agree that tariffs are restrictive and are likely to increase prices while decreasing economic activity. The arguments put forward in defense of tariffs are that other countries have been “ripping off” the U.S. in their trade activity and that certain industries that are strategically important should be protected. The first argument is a misunderstanding of why trade imbalances exist. When there are attractive investment opportunities in the U.S. for foreign investors, including buying Treasuries to fund the federal deficit, they must exchange their currency for U.S. dollars to make those investments. This results in the U.S. having an excess of foreign currency which can only be balanced by U.S. consumers purchasing more goods from foreign countries. Unless the U.S. wants to become less attractive for investment and/or reduce the budget deficit, we will continue to have trade deficits with less investible countries. While there are certain industries that we may want to protect via tariffs, we should only do so knowing that there is an economic cost to that protection.
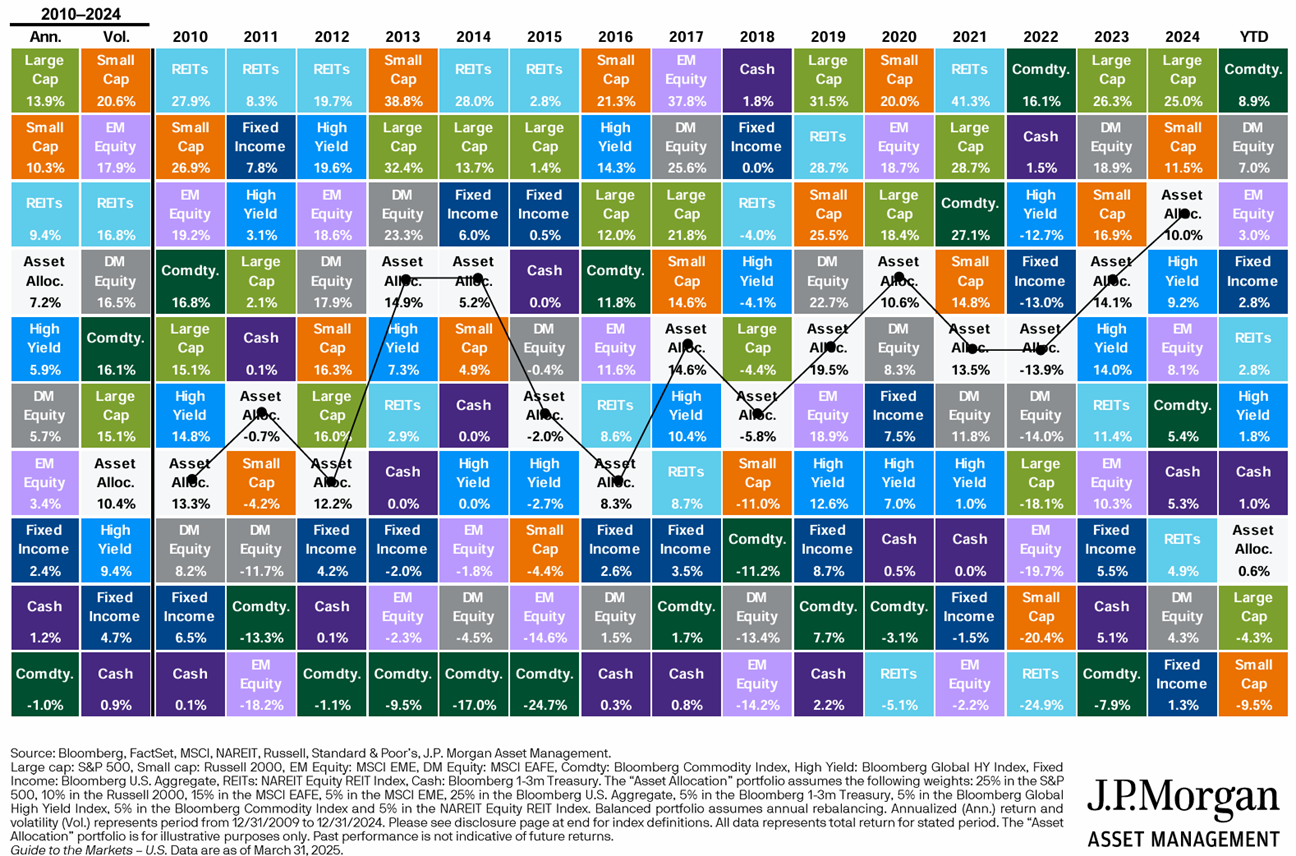
The changing tariff policy and the impact from DOGE reforms is creating uncertainty, but as investors we should be careful in how we react to the uncertainty. First, remember that government policy has an indirect impact on the economy which has an indirect impact on financial markets. While there may be short-term swings in financial markets as policies are announced, the long-term impact on financial markets is much less certain. Second, don’t forget that a well-diversified portfolio is much broader than the S&P 500 index. While the S&P 500 has been a great performer for the past decade, there are many other asset classes that contribute to portfolio performance. In fact, while the S&P was down 4.3% in the first quarter, there were many asset classes like international stocks and commodities that had positive returns. Below is a table from JP Morgan that shows various asset classes performances over time. As you can see, the best performing asset class in one year is often a poor performer the next year and vice versa.
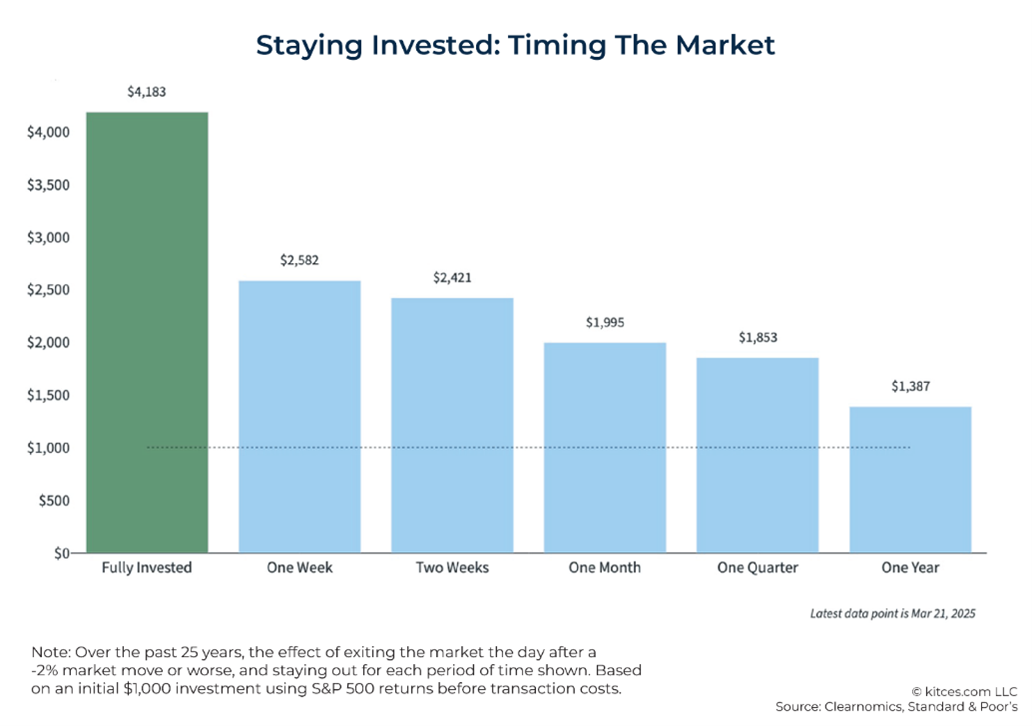
Third, reacting to a bad day in the markets is likely to undermine your long-term goals. The following chart shows the impact of selling after a 2% or greater selloff in the stock market during the past 25 years. Whether you buy back after a week, a month, or a year, on average you would have been worse off than having stayed invested over the 25-year time period.
Are We in A Recession?
At the beginning of the year, most economists and investors were anticipating a soft landing. Midway through this quarter, that anticipation turned to concern about whether or not we were headed for a recession. One of the catalysts for the recession talk was a large drop in the Atlanta Fed’s GDPNow tracker, which went from estimating 2.3% GDP growth in Q1 to negative 1.5% in the course of one week. Almost all of this reduction was a function of a spike in imports in January. The formula for GDP is Consumer Spending plus Business Investment plus Government Spending plus Change in Inventories less Net Imports. As a result, if imports spike, it leads to a drop in the calculation of GDP. There are two reasons the recent spike in imports may not be a red flag indicator of slowing GDP. First, a large amount of the higher import number was the transfer of gold from foreign locations to the US due to an anomaly where US gold prices were higher than foreign gold prices. This was so significant that the Atlanta Fed now has a modified GDPNow calculation that adjusts for gold imports. Second, we believe a large driver of the higher imports was front running of expected tariffs. Companies that imported ahead of expected tariff increases should reduce their imports in future months leading to a reversion of the GDPNow index. We are tracking other real-time indicators of economic activity which have not shown significant reductions in GDP. While there is less certainty about how the economy will perform throughout 2025, we still believe that 2025 could be a growth year, depending on how tariff negotiations play out.
Fed Pause & Interest Rates
In 2024 the Fed began reducing interest rates from a peak of 5.25% to 4.25%. Coming into 2025, most Fed watchers expected continued interest rate reductions. However, due to the economic uncertainty and the stickiness of various inflation indicators, the Fed has paused the reductions for now. We still expect one or two reductions later in the year, but much will depend on how economic policy like tariffs impacts inflation.
Like the Fed pause, consumers and businesses may be pausing economic activity. This is showing up in consumer and business survey data. The Purchasing Managers Index of Manufacturing Activity declined to 49 in March (levels below 50 indicate contraction). Similarly, the University of Michigan consumer confidence index dropped to 57 in March, well below the historical average of 84. These negative indicators are occurring in an economy where the hard measures like job growth, consumer spending and business investment are still very healthy. We are watching to see whether these indications of negative sentiment translate to deteriorating hard measures of economic activity.